It won't sort itself out, but the good news is that reading a basic portfolio is far simpler than it looks. You don't need a finance degree – you need to know which handful of numbers actually matter and what each one is telling you. Once you can do that, the dashboard stops being intimidating and becomes a tool you can use to make real decisions. Here's how to read your portfolio, step by step, without feeling lost.
Start With the Big Picture: Total Value and Cost Basis
Before you zoom into any single investment, look at the two headline numbers almost every platform shows at the top: your total portfolio value and your total gain or loss.
Your total value is simply what everything in your account is worth right now if you sold it all at today's prices. It moves up and down daily as markets move, which is completely normal – don't read too much into a single day's wiggle. The number that gives it meaning is your cost basis, which is the total amount you actually put in. The difference between the two is your overall gain or loss, usually shown as both a dollar figure and a percentage.
What this means for your money: the percentage is the honest scorecard. A $500 gain sounds great until you realize you invested $50,000 to get it (a 1% return), and underwhelming until you realize you only invested $2,000 (a 25% return). Always read gains and losses as percentages of what you put in, not as raw dollar amounts. That single habit prevents most beginner misreadings.
Understand Your Holdings: What You Actually Own
Next, look at the list of individual holdings. Each line is one investment you own, and the jargon here trips people up more than the math does. A few quick translations clear most of the fog.
A stock is a share of ownership in a single company (Apple, Coca-Cola). A bond is essentially a loan you've made to a government or company that pays you interest. An ETF or mutual fund is a single investment that holds a basket of many stocks or bonds at once – buying one share of a total-market ETF means you own a tiny slice of hundreds or thousands of companies in one go. That's why funds are so popular with everyday investors: instant diversification without picking individual companies.
For each holding, your platform typically shows the quantity (how many shares you own), the current price per share, the total value of that position, and its gain or loss. You'll also see a ticker symbol – a short code like VOO or AAPL that's just the investment's nickname for trading. None of it is complicated once you know that each row is simply "what I own, how much of it, and how it's doing."
Read Your Asset Allocation: The Pie Chart That Matters Most
If there's one part of your portfolio worth understanding deeply, it's your asset allocation – usually shown as that pie chart breaking your money into categories like stocks, bonds, and cash. This isn't decoration. It's the single biggest driver of both your potential returns and your risk.
Here's the core idea in plain terms. Stocks tend to grow more over the long run but swing up and down sharply, so they're higher risk and higher potential reward. Bonds are generally steadier but grow more slowly, acting as a cushion when stocks fall. Cash is stable but barely grows. Your allocation – the mix of these – determines how bumpy your ride will be and roughly how much growth you can expect over time.
What this means for your money: a portfolio that's 90% stocks will likely grow faster over decades but can drop frighteningly in a bad year, while one that's 50% stocks and 50% bonds grows more slowly but falls less hard. Neither is "right" – the correct mix depends on your timeline and how much volatility you can stomach without panic-selling. A common rule of thumb is that the longer until you need the money, the more stocks you can reasonably hold, but it's a starting point for thought, not a prescription. Knowing your allocation tells you, at a glance, what kind of investor your portfolio currently makes you.
Check Your Diversification: Are Your Eggs in One Basket?
Closely related to allocation is diversification – how spread out your money is. Many platforms show this as a breakdown by sector (technology, healthcare, energy), by geography (US vs. international), or by company size.
The thing to watch for is concentration: too much of your money riding on one company, one sector, or one country. If a single stock makes up a huge chunk of your portfolio, your financial future is unusually tied to that one company's fortunes, which is a real risk even if the company is excellent today. Spreading your money across many holdings means no single failure can sink you, and it's one of the few genuinely free protections in investing.
What this means for your money: glance at whether any one holding or sector dominates your pie. If your "diversified" portfolio is actually 60% one tech stock, that's worth knowing, because it means your risk is far higher than the number of holdings suggests. Broad funds handle most of this automatically, which is part of their appeal.
Don't Get Distracted by Daily Movement
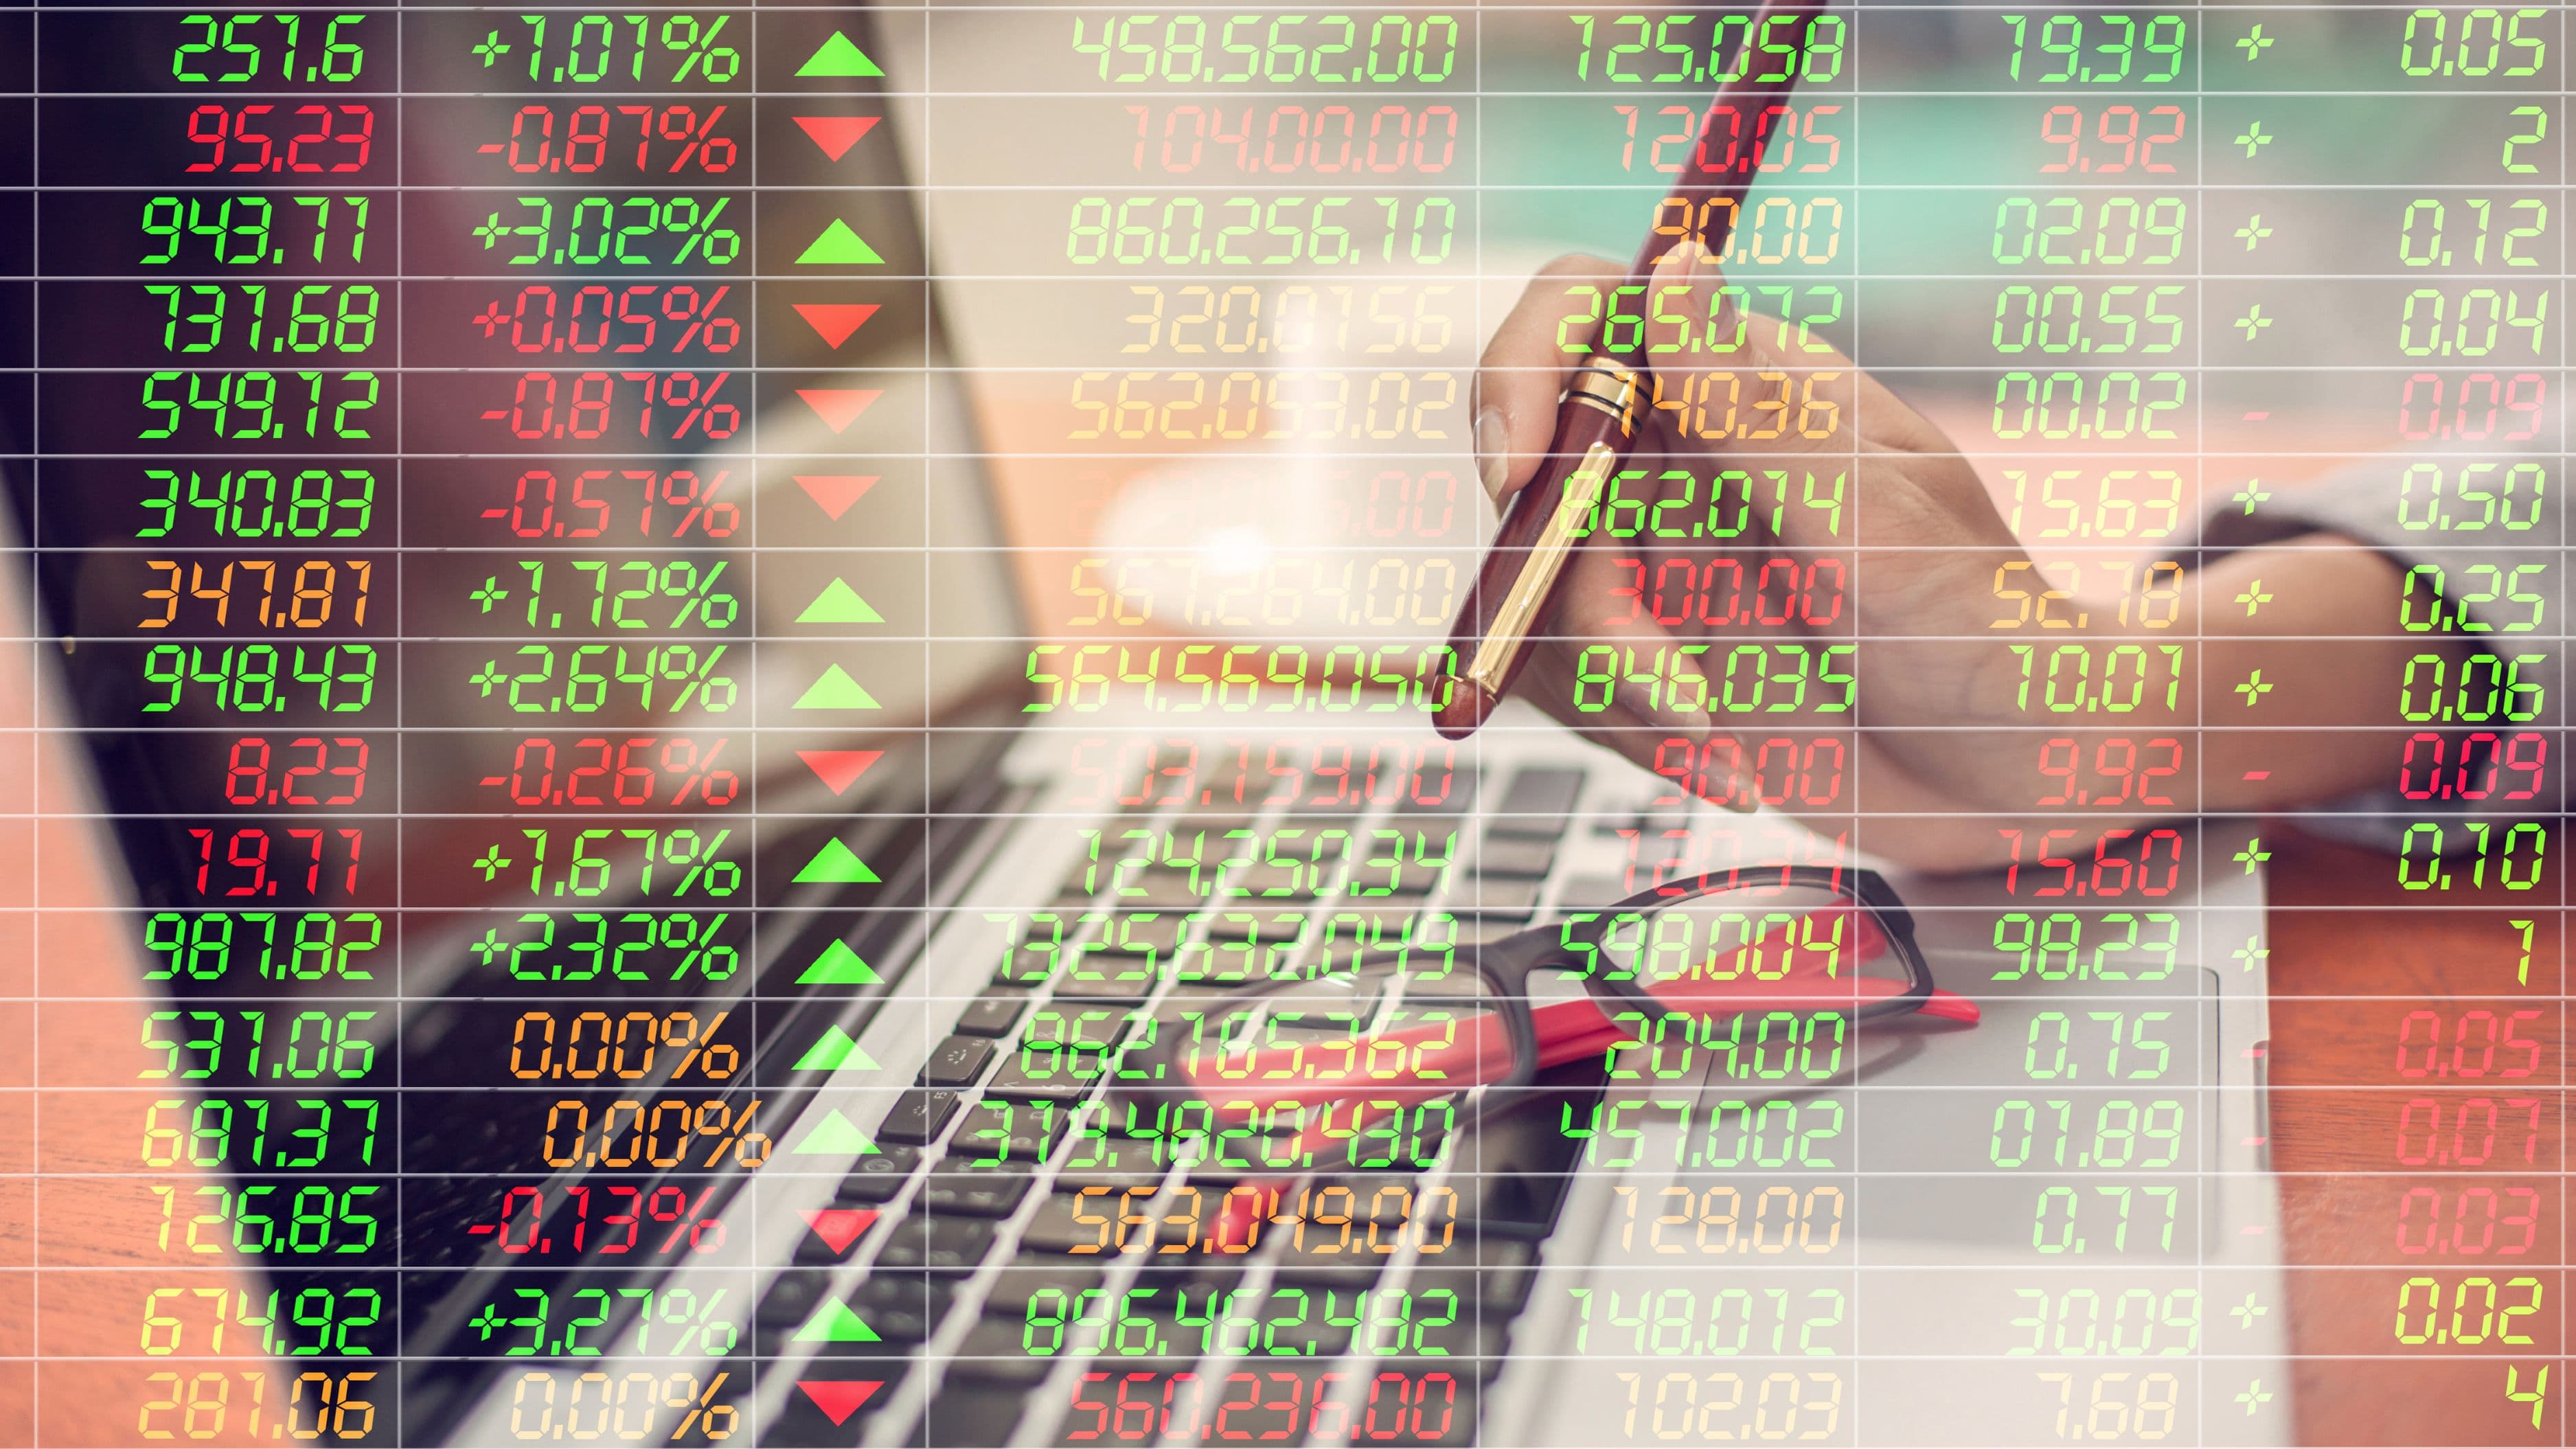
One of the easiest ways to feel lost – and stressed – is to fixate on the daily green and red numbers. Your portfolio will be up some days and down others, sometimes by amounts that feel alarming. This is normal market behavior, not a sign anything is broken.
For long-term investors, daily and even monthly swings are mostly noise. What matters is the trend over years, not the flicker of any single session. Checking your portfolio obsessively tends to make people anxious and prone to bad decisions like selling in a panic when prices dip – which locks in losses that would likely have recovered with patience.
What this means for your money: a healthy habit is to check your portfolio occasionally to stay informed and rebalance when needed, not daily to ride the emotional rollercoaster. The number that deserves your attention is your long-term progress toward your goals, not today's tick.
A Quick Note on Fees
One number that's easy to miss but quietly important is fees. Funds charge an expense ratio – a small annual percentage of your money that covers the fund's costs. It sounds tiny (often a fraction of a percent), but over decades, high fees can eat a meaningful share of your returns through compounding.
What this means for your money: it's worth checking the expense ratio on your funds, usually listed in the holding's details. Broad index funds tend to have very low fees, while some actively managed funds charge much more. Lower fees mean more of your money stays invested and working for you, so this is a number worth a glance even though your platform won't shout about it.
Key Takeaways You Can Use Right Now
To put this into action the next time you open your account, focus on these:
Read gains and losses as percentages, not dollar amounts, so you judge performance against what you actually invested.
Check your asset allocation (your stocks/bonds/cash mix) first – it's the biggest driver of your risk and growth, and it should match your timeline and comfort with ups and downs.
Look for over-concentration in any single holding, sector, or country, since broad diversification is one of your best free protections.
Ignore the daily noise and judge your portfolio on its long-term trend instead of today's red or green.
Glance at your fund fees (expense ratios), because lower costs leave more of your returns working for you over time.
FAQ
How often should I actually check my portfolio? For long-term investing, checking every few months is plenty for most people, with a more thorough review once or twice a year to see whether your mix still fits your goals. Checking daily tends to increase stress and tempt you into reactive decisions without improving results.
What's the difference between my portfolio value and my returns? Your portfolio value is what everything is worth today; your returns are how much you've gained or lost compared to what you invested. A high value doesn't automatically mean strong returns – someone who invested a large amount could have a big value but a small percentage return. The percentage tells you how well your money has actually performed.
Is a portfolio that's down right now a bad sign? Not necessarily. Markets rise and fall, and temporary declines are a normal part of investing, especially for stock-heavy portfolios. What matters more is your long-term trend and whether your investments still suit your goals. Selling simply because prices dropped often turns a temporary paper loss into a permanent real one.
Do I need to understand every holding in a fund? No. The point of a fund is that it spreads your money across many investments so you don't have to track each one. It's enough to understand roughly what the fund holds (for example, "US stocks" or "global bonds") and how it fits your overall allocation. The details inside are managed for you.
What should I do if my allocation doesn't match my goals? This is where rebalancing comes in – adjusting your holdings back toward your target mix, either by directing new contributions to the underweighted area or by shifting existing money. Since these are personal decisions with tax and timing trade-offs, it can be worth talking to a qualified financial professional, especially as your portfolio grows.
The Bottom Line
Reading a portfolio isn't about understanding every number on the screen – it's about knowing which few actually matter. Start with your total value and your gain or loss as a percentage, understand that each holding is just something you own, and pay closest attention to your asset allocation and diversification, since those drive your real risk and growth. Tune out the daily noise, keep an eye on fees, and judge everything against your long-term goals. Do that, and the dashboard that once felt like a foreign language becomes exactly what it should be: a clear, useful picture of where your money stands. This is general information, not personalized financial advice, so for decisions specific to your situation, consider speaking with a qualified financial professional.
📚 Sources
U.S. Securities and Exchange Commission (Investor.gov) – Asset allocation, diversification, and rebalancing: https://www.investor.gov/introduction-investing/investing-basics/how-stock-markets-work/asset-allocation
U.S. Securities and Exchange Commission (Investor.gov) – Mutual funds and ETFs basics: https://www.investor.gov/introduction-investing/investing-basics/investment-products/mutual-funds-and-exchange-traded-1
FINRA – Understanding investment fees and expense ratios: https://www.finra.org/investors/learn-to-invest/key-investing-concepts/understanding-investment-professional-fees
U.S. Securities and Exchange Commission (Investor.gov) – The importance of diversification: https://www.investor.gov/introduction-investing/general-resources/news-alerts/alerts-bulletins/investor-bulletins/diversification
Consumer Financial Protection Bureau – Basics of investing and risk: https://www.consumerfinance.gov/about-us/blog/investing-basics/